


Market Summary
We have maintained a bullish stance since late April, and the market has continued to reward that view. The bulk of the technical data remains exceptionally strong. Both the S&P 500 and Nasdaq 100 reached all-time highs last week, a clear sign of market strength.
Even more impressive is how the market has powered higher in the face of negative news. Rather than pulling back, stocks have continued to climb, a classic hallmark of a strong bullish environment. This type of price action suggests that buyers are firmly in control and that underlying demand remains robust.
S&P 500 Index – Bullish Trend Confirmed
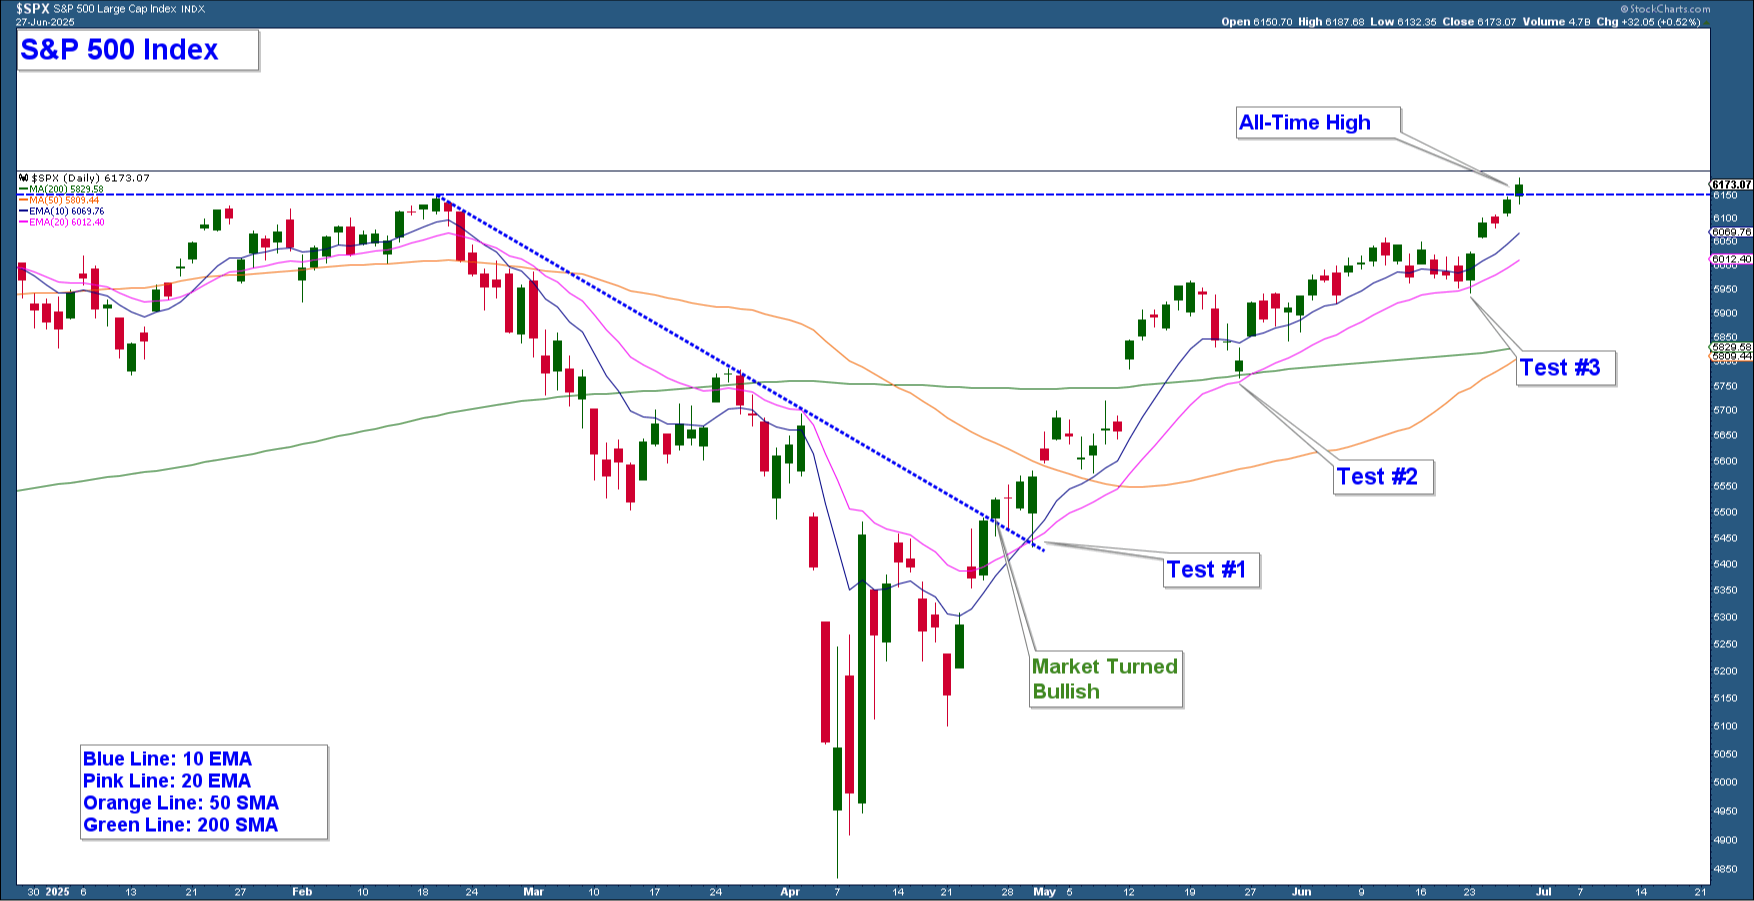
The first chart shows a six-month view of the S&P 500 Index, capturing the February 2025 peak, the subsequent bear market decline, and the full recovery to new all-time highs. This chart includes four moving averages: the 10-day and 20-day exponential moving averages (EMAs), and the 50-day and 200-day simple moving averages (SMA's), with each labeled by color for reference.
The downtrend line defined the bear market, and the 10 and 20-day EMA's acted as resistance for the index as it fell. I marked the candle that broke above this trendline as the turning point where I shifted to a bullish outlook. Since then, the index has respected the rising 20-day EMA, which I use as a key short-term support level. I’ve highlighted three candles where the index pulled back to this moving average and held, reinforcing its role as an area of support.
Most recently, the index broke out above its prior all-time high from February, a bullish development that confirms strong upward momentum. As long as the index continues to hold above the 20-day EMA, I will maintain a bullish short-term view of the market.
Risk-On Leadership Confirmed
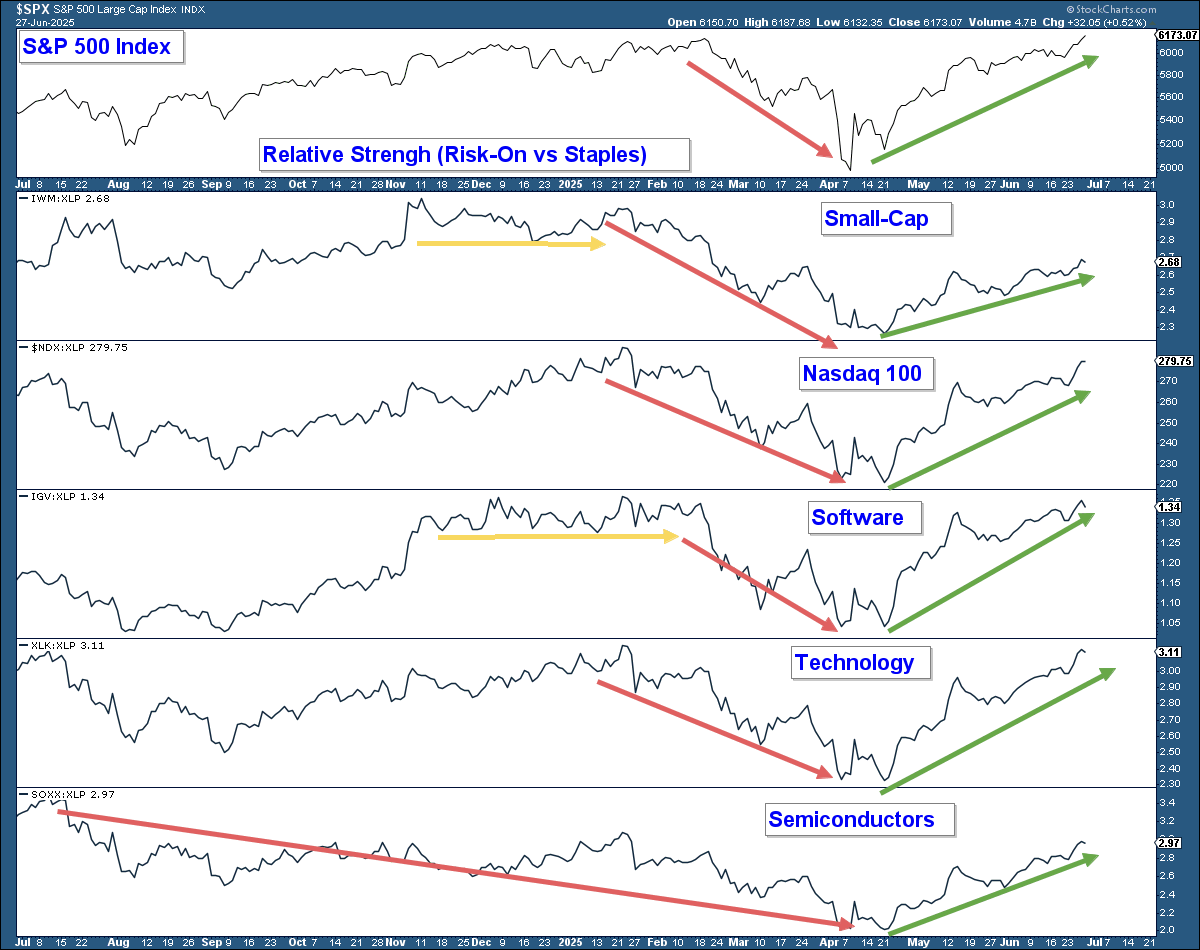
This chart compares the S&P 500 Index (top panel) with five relative strength charts in the panels below. Each relative strength line compares a risk-on sector or group against Consumer Staples (XLP), which is traditionally considered a defensive, risk-off area of the market. The five groups shown are: Small-Caps (IWM), Nasdaq 100, Computer Software (IGV), Technology (XLK), and Semiconductors (SOXX).
Since the April bottom, all five relative strength lines have been trending sharply higher, confirming a clear shift toward a risk-on environment. This kind of sector leadership is a strong sign of internal market strength and supports the bullish case.
During the bear market earlier this year, these same relative strength lines were falling, indicating that investors were rotating away from growth and into safer areas like Consumer Staples. Several of these lines showed signs of weakness even before the broader market peaked in February, either flattening out or forming negative divergences. These early clues often suggest that risk appetite is fading, and in this case, they preceded the sharp market decline.
With all five groups now leading again, the message from this chart is clear: risk appetite has returned, which further reinforces the bullish trend.
Participation Lags - Stock Selection Matters
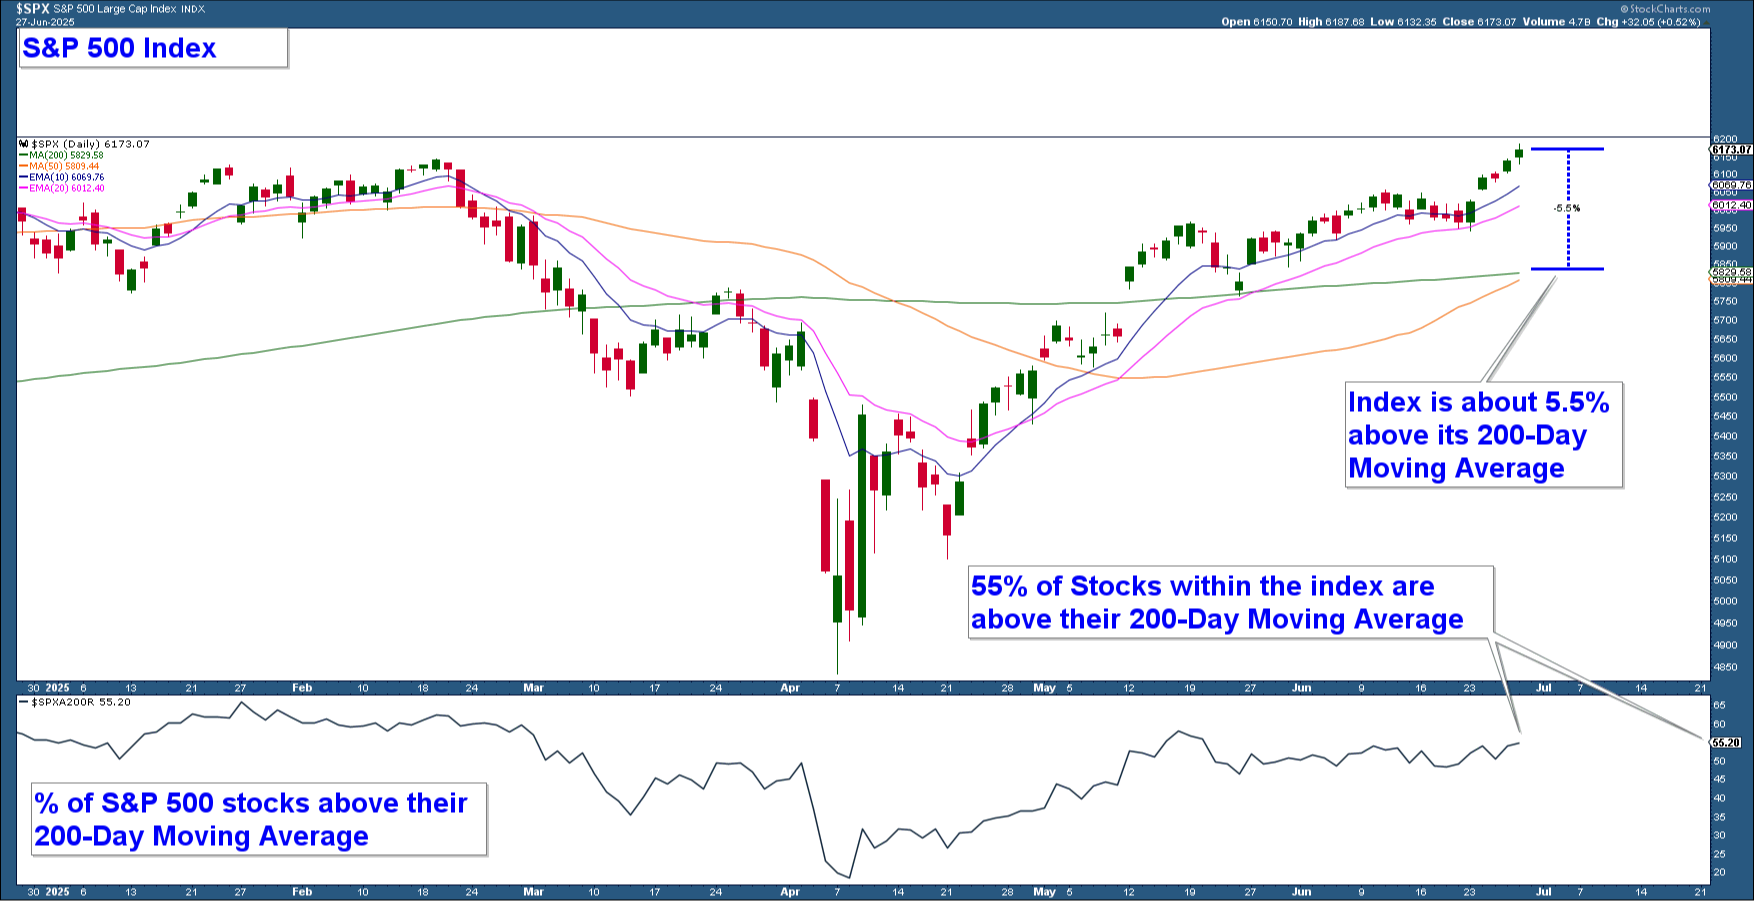
In the top panel, we see the S&P 500 Index, which is currently trading about 5.5% above its 200-day simple moving average. The lower panel tracks the percentage of S&P 500 stocks that are trading above their 200-day moving averages. Despite the index reaching all-time highs and being comfortably above its 200-day moving average, only about 55% of its component stocks are in long-term uptrends.
This divergence suggests that a relatively small number of stocks are doing much of the heavy lifting. While the overall trend remains bullish, the fact that nearly half of the index's stocks are not participating speaks to uneven breadth. In isolation, this might be viewed as a yellow flag, but given the broader technical strength across the market, including risk-on sector leadership and strong price action, it’s more of a nuance than a warning sign at this point.
What this does emphasize, however, is the importance of stock selection. In an environment where the broader market is strong but participation is limited, being selective and focusing on the strongest individual setups becomes critical to successful investing.
Client Account Review
Client accounts are nearly fully invested. As long as the market remains in a bullish trend, we will continue to follow our growth-focused strategy, emphasizing stocks with strong fundamentals and relative strength. Our approach remains disciplined, with purchases made at strategic entry points where the risk-to-reward ratio is clearly in our favor.
At the core of our process is risk management. While the current environment is strongly bullish, we know that conditions can change. When the technical evidence begins to shift, we will move quickly to protect capital. For now, the trend is up, and we intend to ride that wave while it lasts.