


August 2025 Market Update
The market continues to show strength, with major indexes posting modest gains in July and maintaining their bullish trends. We’re still seeing strong technical conditions, with the S&P 500 holding above key moving averages and risk-on sectors leading. While breadth remains uneven, the overall picture supports a bullish outlook. In this month’s update, we review three key charts that continue to guide our strategy and highlight what we’re watching moving forward.
Chart #1: S&P 500 Index
20-Day EMA Continues to Guide the Uptrend
This chart tracks the S&P 500 Index back to the market peak earlier this year and includes the key moving averages we’ve been watching closely: the 10 and 20-day exponential moving averages (EMA), and the 50 and 200-day simple moving averages (SMA).
As I’ve mentioned in previous newsletters, I’ve been using the 20-day EMA as a short-term gauge of market strength. When the index is above this moving average, I view the short-term trend as bullish. Recently, the index briefly dipped below this line, but immediately rebounded the next day and has now remained above it for three consecutive sessions. That quick recovery helps reaffirm the market's short-term strength.
I’ve also drawn a new trendline on the chart based on this recent price action, providing another visual reference point for the current uptrend. The index has now tested the 20-day EMA four times and held each time, confirming it as a reliable area of support.
With the index holding above all major moving averages and showing strong price structure, the technical picture remains bullish across short, intermediate, and long-term time frames.
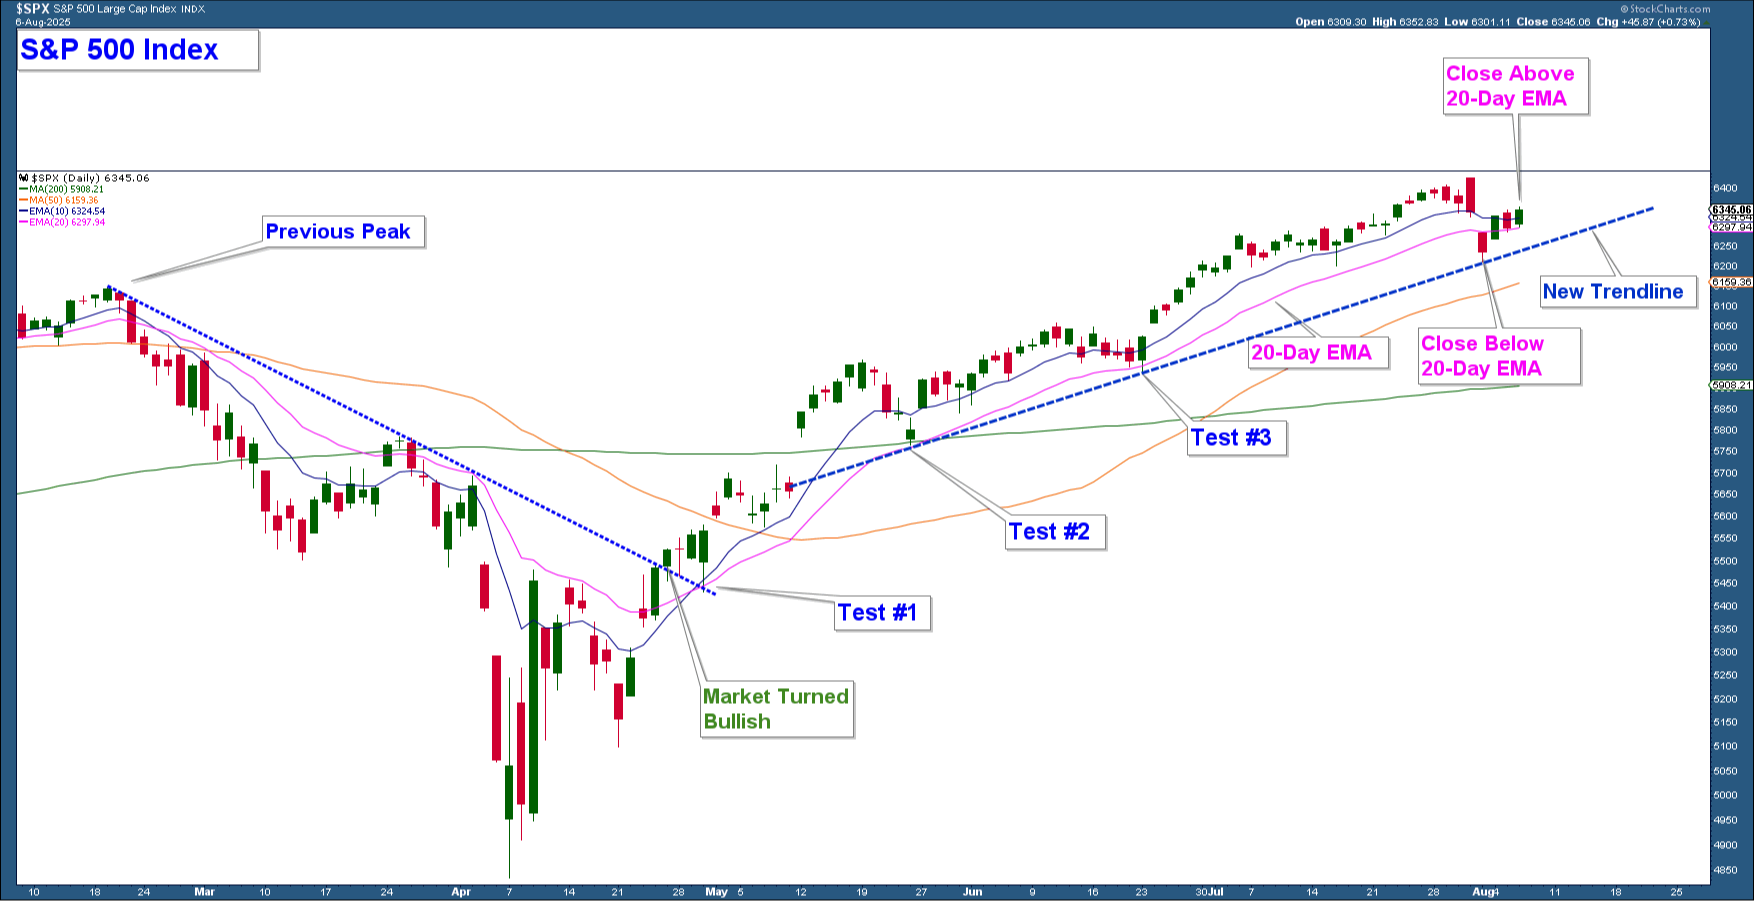
Chart #2: Risk-On Sectors Continue to Lead
This relative strength chart compares five risk-on areas of the market against the Consumer Staples sector (XLP), which is traditionally considered a defensive, risk-off area. The S&P 500 Index is shown in the top panel for reference.
Earlier this year, during the market correction, all five risk-on segments were underperforming Consumer Staples. This rotation into defensive names confirmed a risk-off environment at the time. These periods of underperformance are marked by red arrows on the chart.
Since the market bottomed in April, each of these risk-on areas has reversed course and is now trending higher relative to XLP. This shift signals a clear return to risk appetite among investors, which is a healthy and important sign of strength supporting the broader market’s bullish outlook.
As long as these risk-on sectors continue to lead, the technical backdrop remains supportive of further market gains.
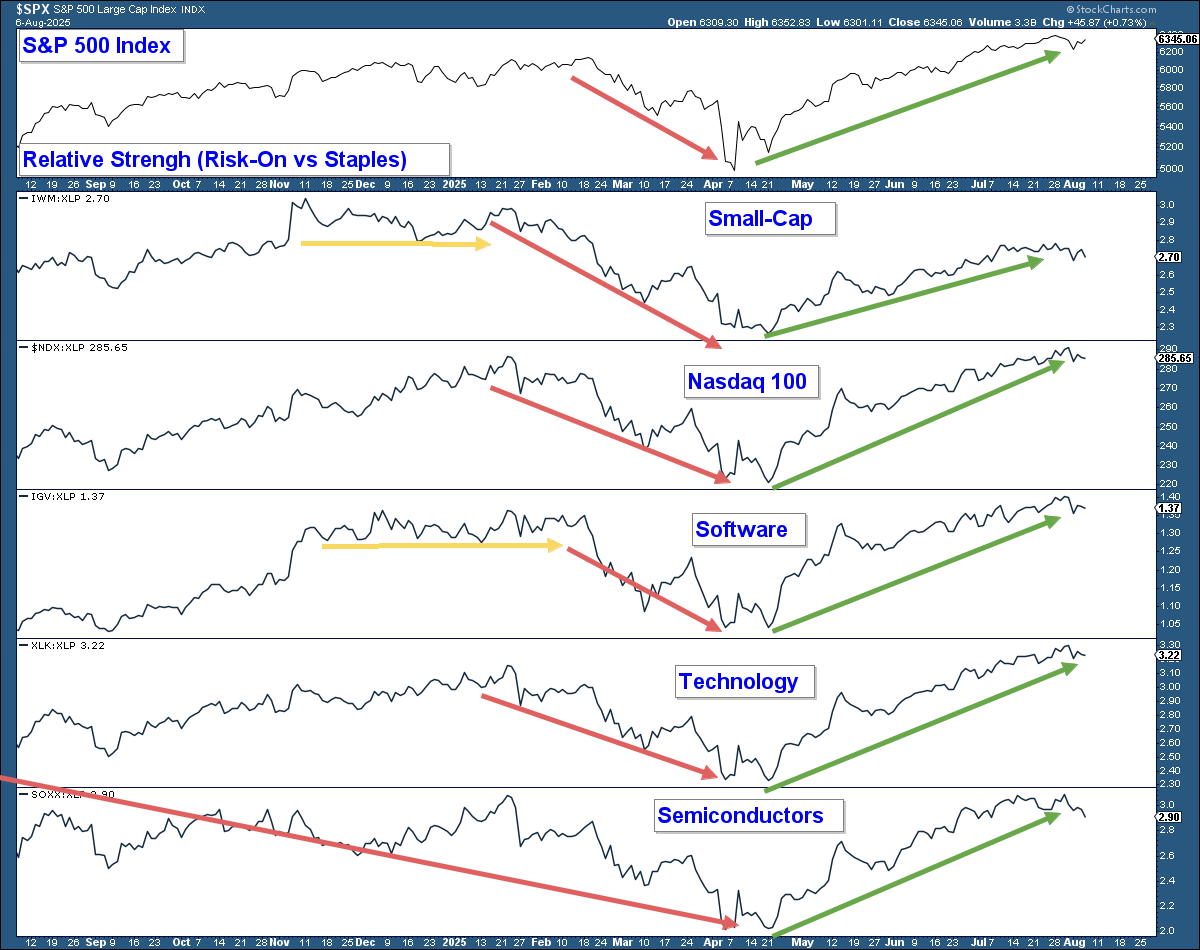
Chart #3: Mixed Breadth, but Bullish Technical Picture Remains
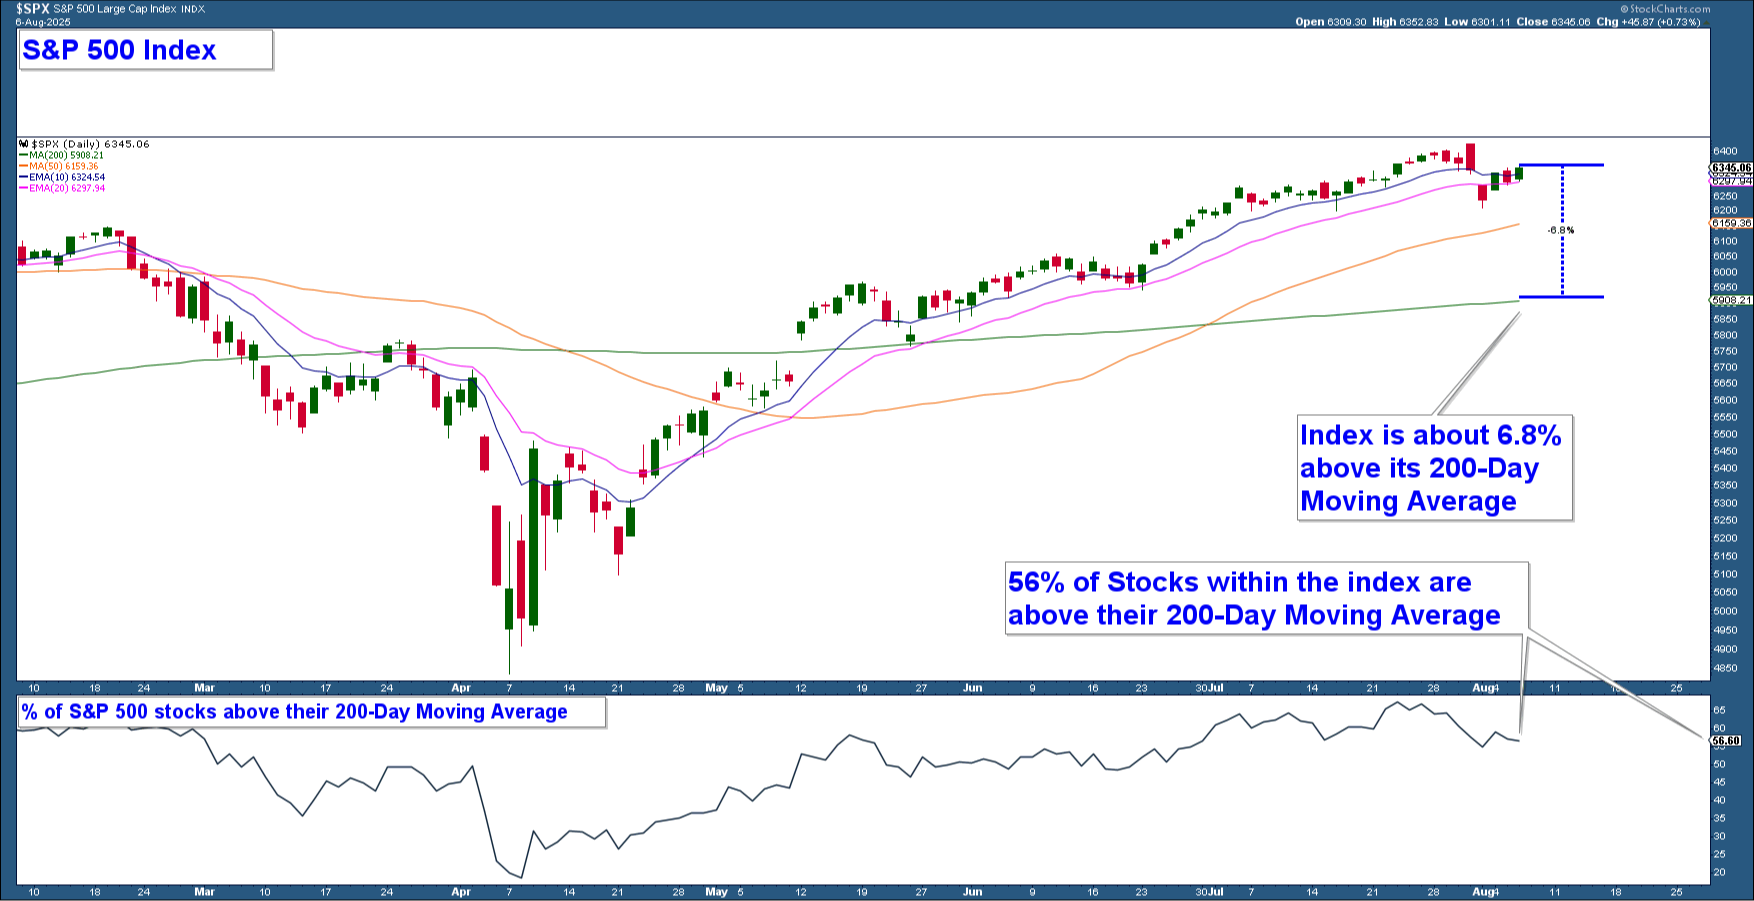
This chart shows the S&P 500 Index in the top panel, with key moving averages included (10-day EMA, 20-day EMA, 50-day SMA, and 200-day SMA). The index is currently trading about 6.8% above its 200-day moving average, reflecting continued strength in large-cap stocks.
In the lower panel, we look at market breadth by tracking the percentage of stocks within the S&P 500 that are trading above their 200-day moving averages. As of now, only about 56% of the stocks meet that criteria, meaning a significant portion of the index is underperforming the broader move.
This imbalance highlights that while the index itself is strong, performance is concentrated in fewer names. It reinforces the idea that stock selection is especially important in this environment. Although this chart isn’t as bullish as the others, the overall weight of technical evidence remains positive, and this breadth data doesn’t raise major concerns at this time.
Client Account Update
Our current equity allocation is about 40%. This lower exposure isn’t due to a shift toward defensive positioning, but rather the result of short-term portfolio adjustments. Specifically, we reduced exposure to certain positions ahead of earnings and are maintaining flexibility to re-enter at favorable points.
Many of the stocks we hold are growth-oriented names with higher-than-average volatility, so even with lower allocation, we remain meaningfully exposed to market upside.
I will be adding to our equity allocation strategically, focusing on stocks with strong fundamentals and relative strength as they break out from solid technical setups. This approach allows us to participate in the upside while managing risk and timing entries for the best reward-to-risk opportunities.